Kubes - Analytical Cubes
What is a Kube?
Kubes are Data Models or the metadata layer that helps DataKubes understand how data is structured in the databases it manages. This includes precise details about the tables that hold related data, as well as the types of fields present in those tables. This methodology enables a more comprehensive and organized representation of the information stored in the database, facilitating a precise understanding of how data is interconnected and structured across various tables, as well as the nature of the fields within them.
How to Create a Kube
To create a Kube, follow these steps:
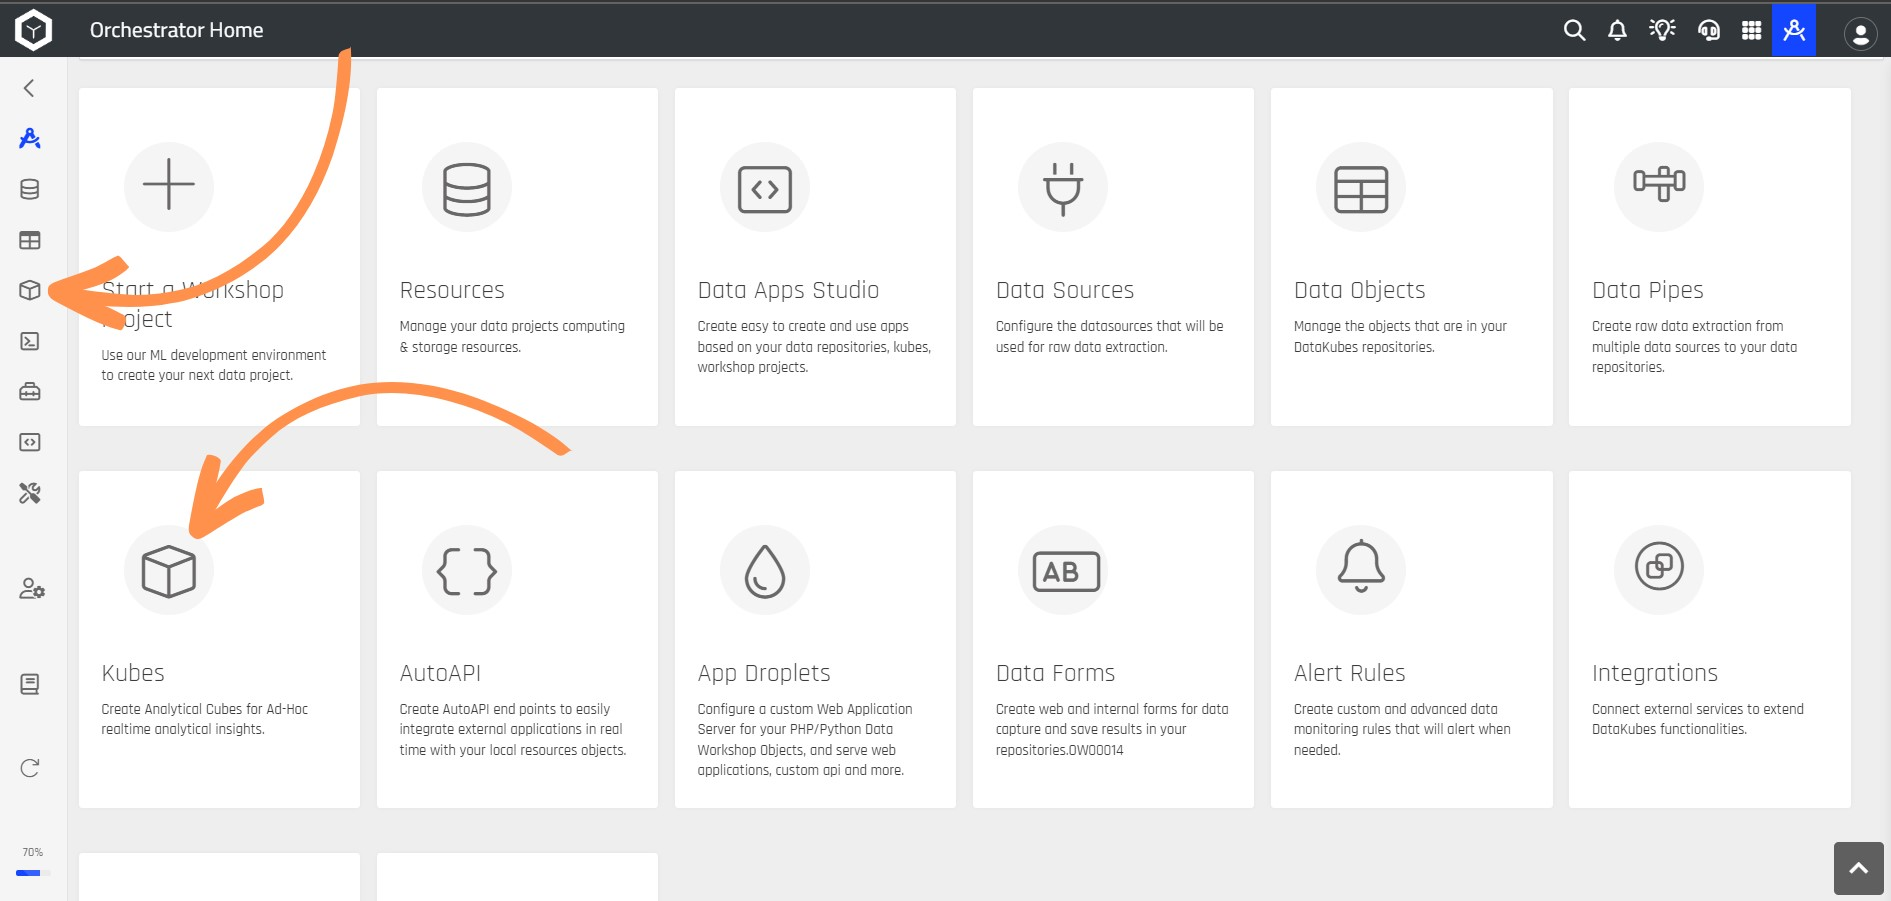
Step 1: From your Orchestrator's Home page, select the Kube tool. You can choose either of the two options indicated in the image.
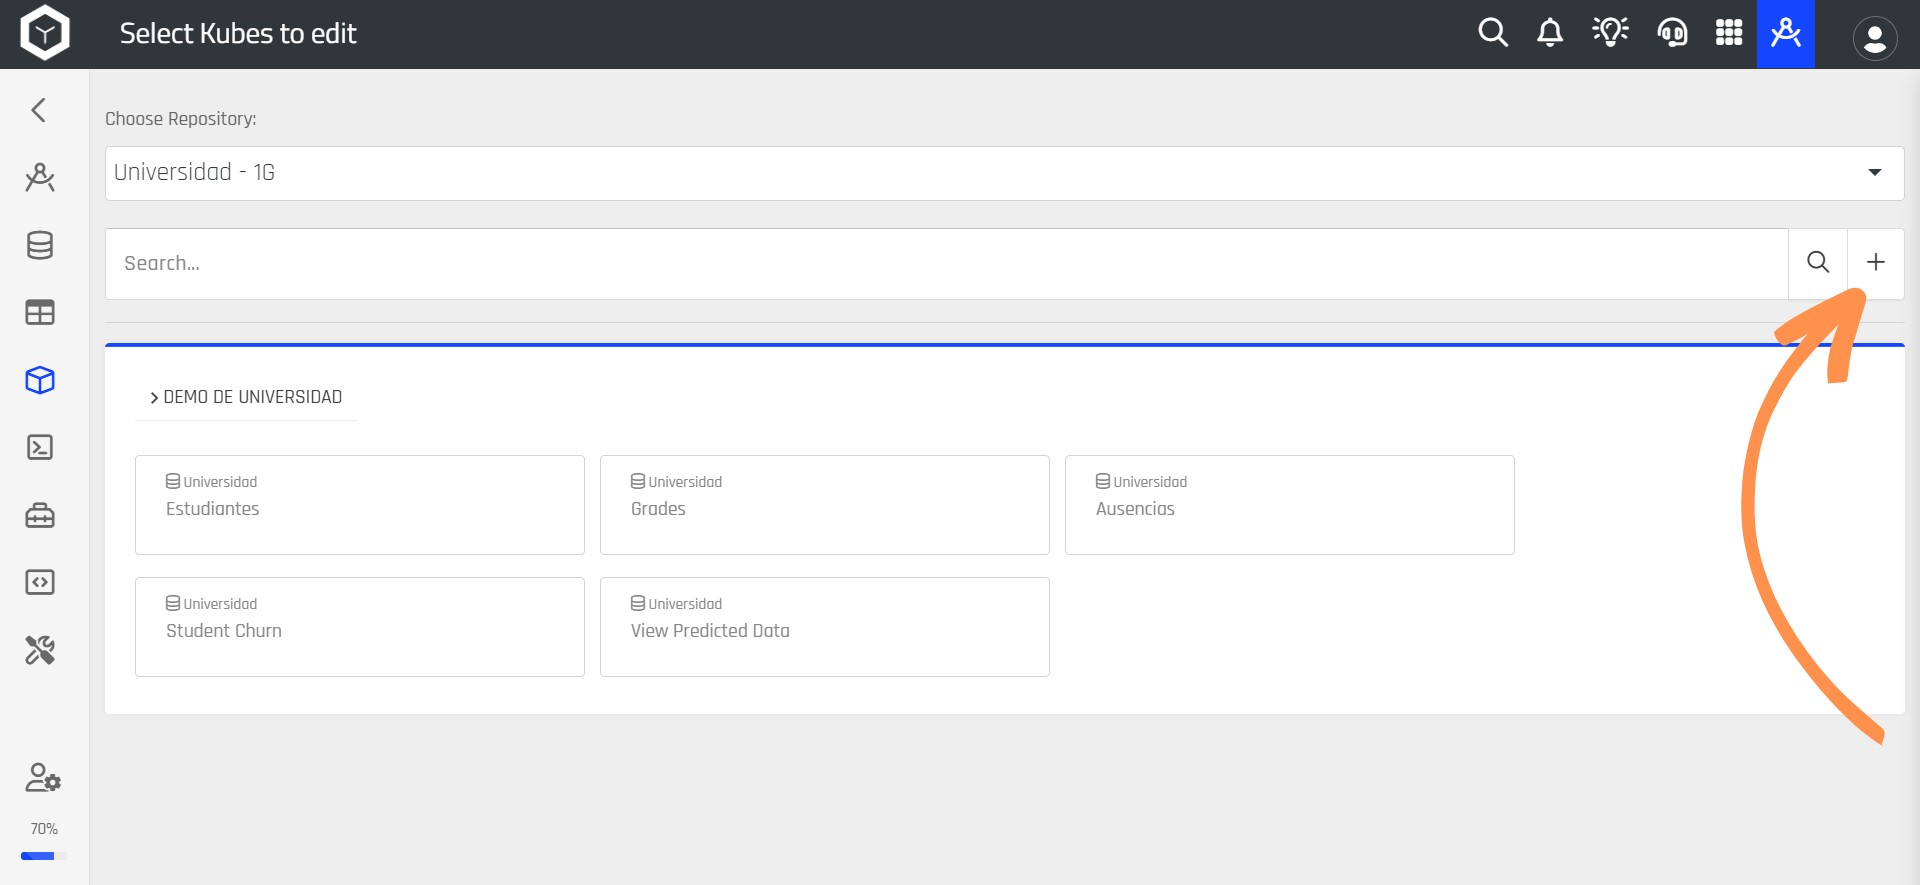
Step 2: You will then be taken to a new window where you can see all the Kubes you've created listed, along with the repository they are located in. To create a new Kube, click the + button.
Step 3: A new screen will open for pre-configuration, and you should fill it in with the relevant information.
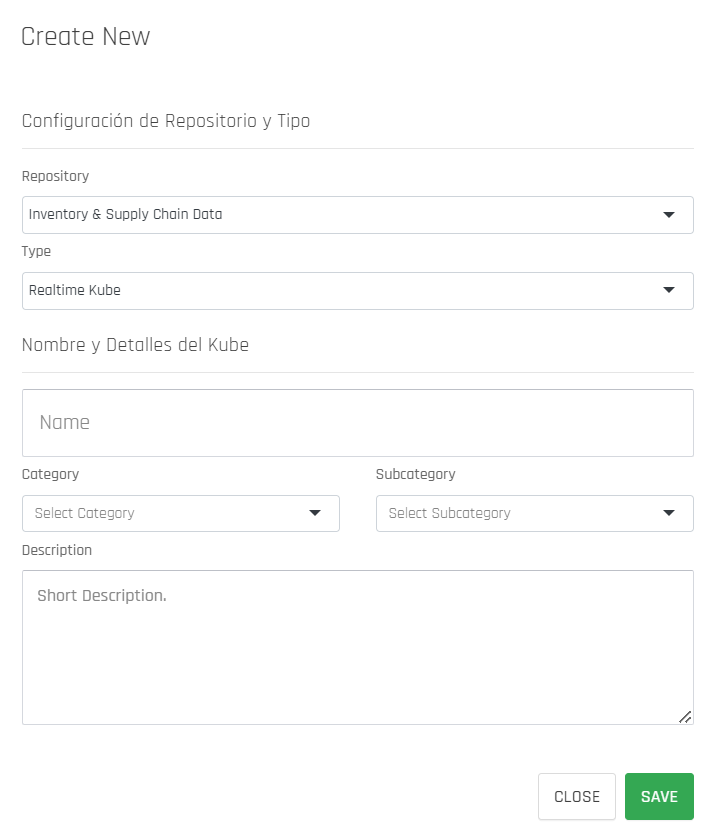
The following table explains each section of the form in more detail:
| Section | Description |
|---|---|
| Repository | Select the repository from which the data will be used to create the new Kube. |
| Type | Choose between Realtime Kube or DataWorkshop Object. Realtime Kubes allow you to join multiple tables and select the data you want to display, while DataWorkshop Objects represent objects from DataKubes Workshop that run code in cloud computing and display their output in an output file saved by the object. |
| Name | Enter a name for your Kube. |
| Category | Optionally, you can assign a category to your Kube, which helps you organize the Kubes in your repository. |
| Subcategory | This section is optional, and you can add a subcategory to your Kube if desired. |
| Description | Optionally, you can add a description for your Kube. |
Step 4: Click the SAVE button.
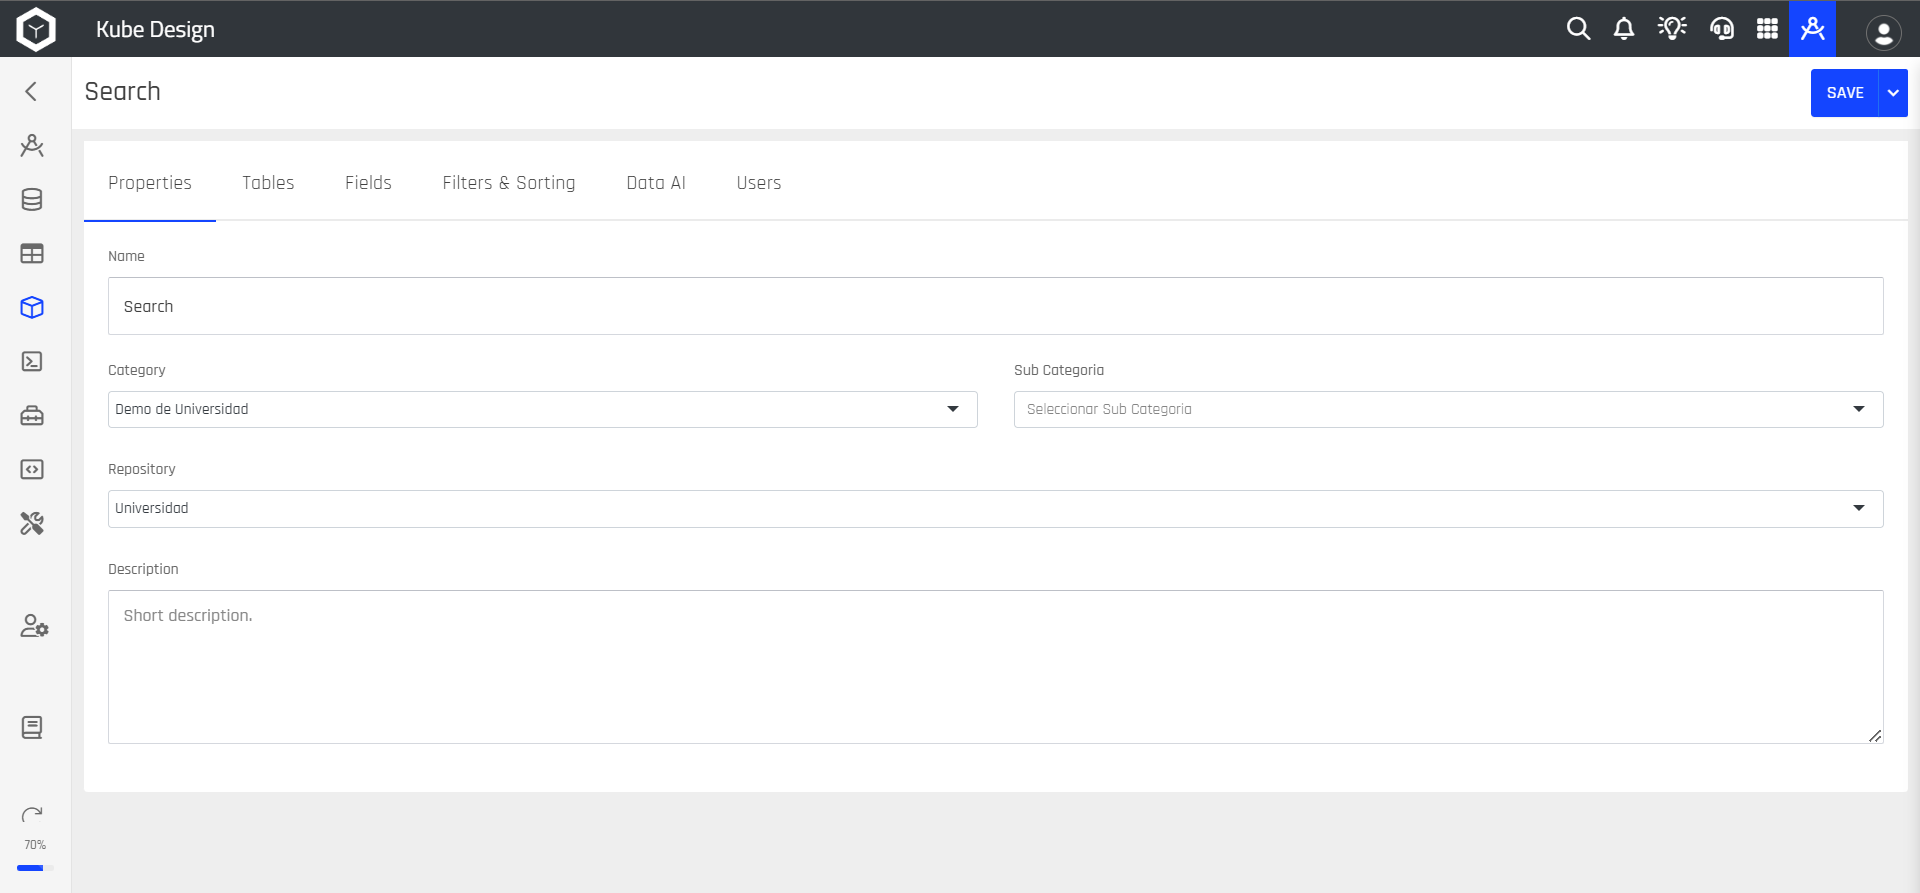
Step 5: Next, you will continue configuring your Kube, where you will first see the Properties section that was configured in the previous step.
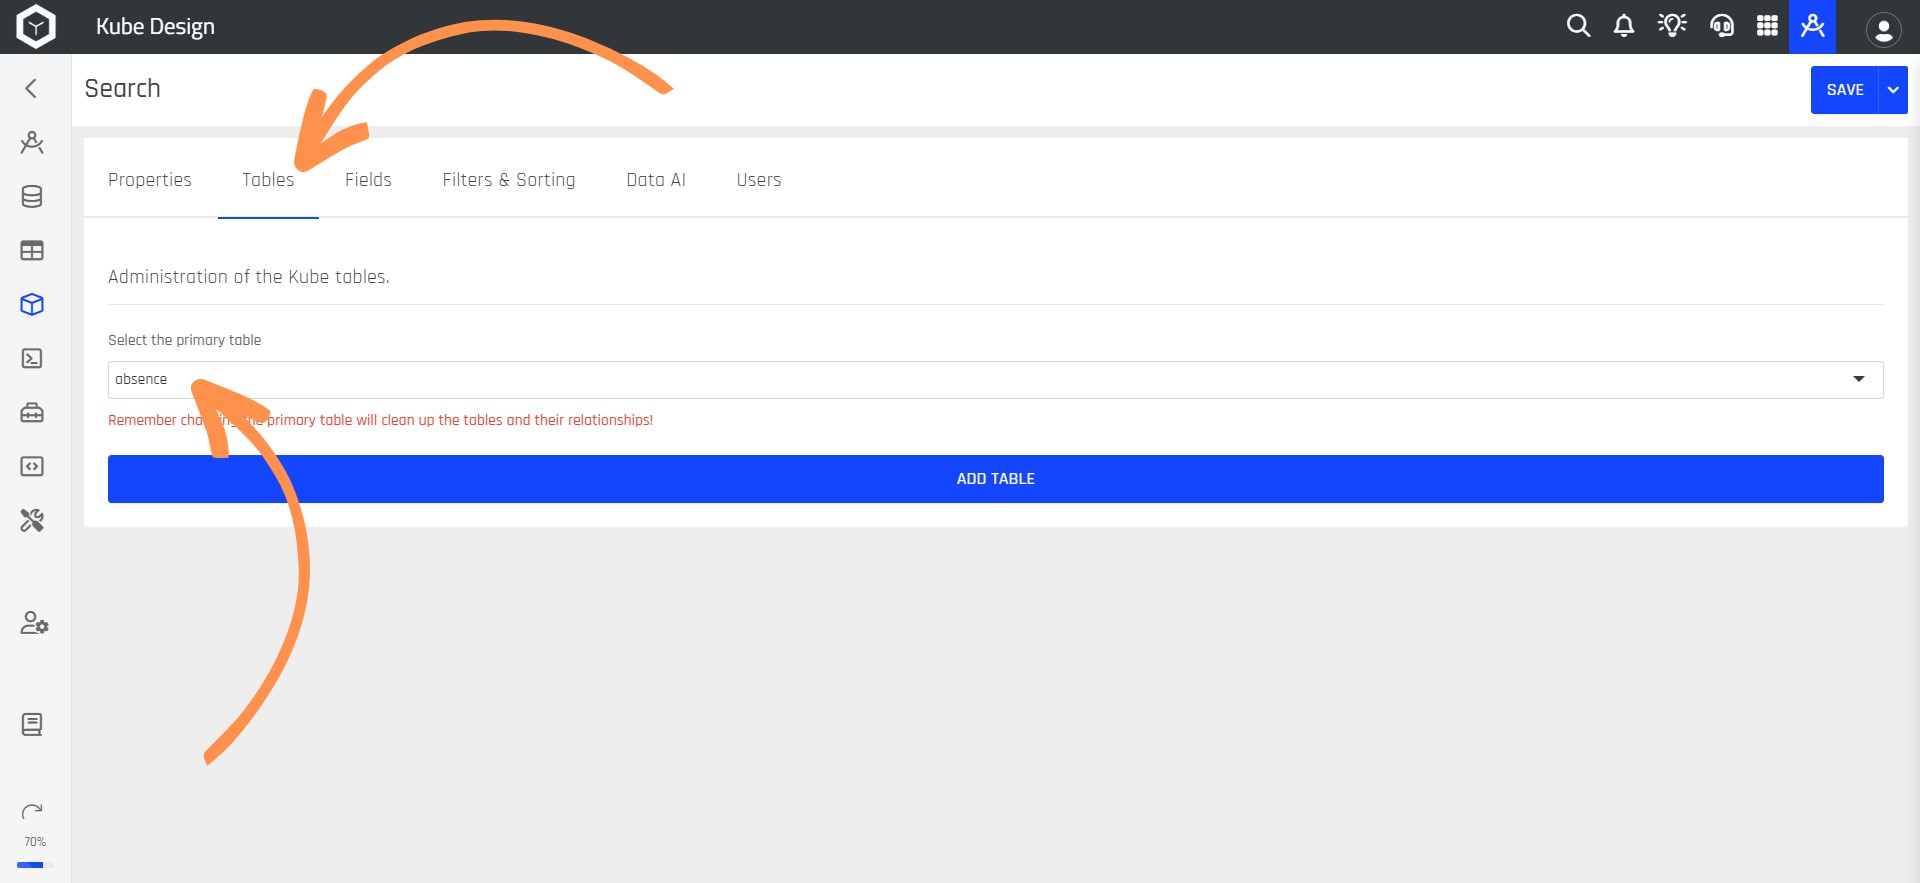
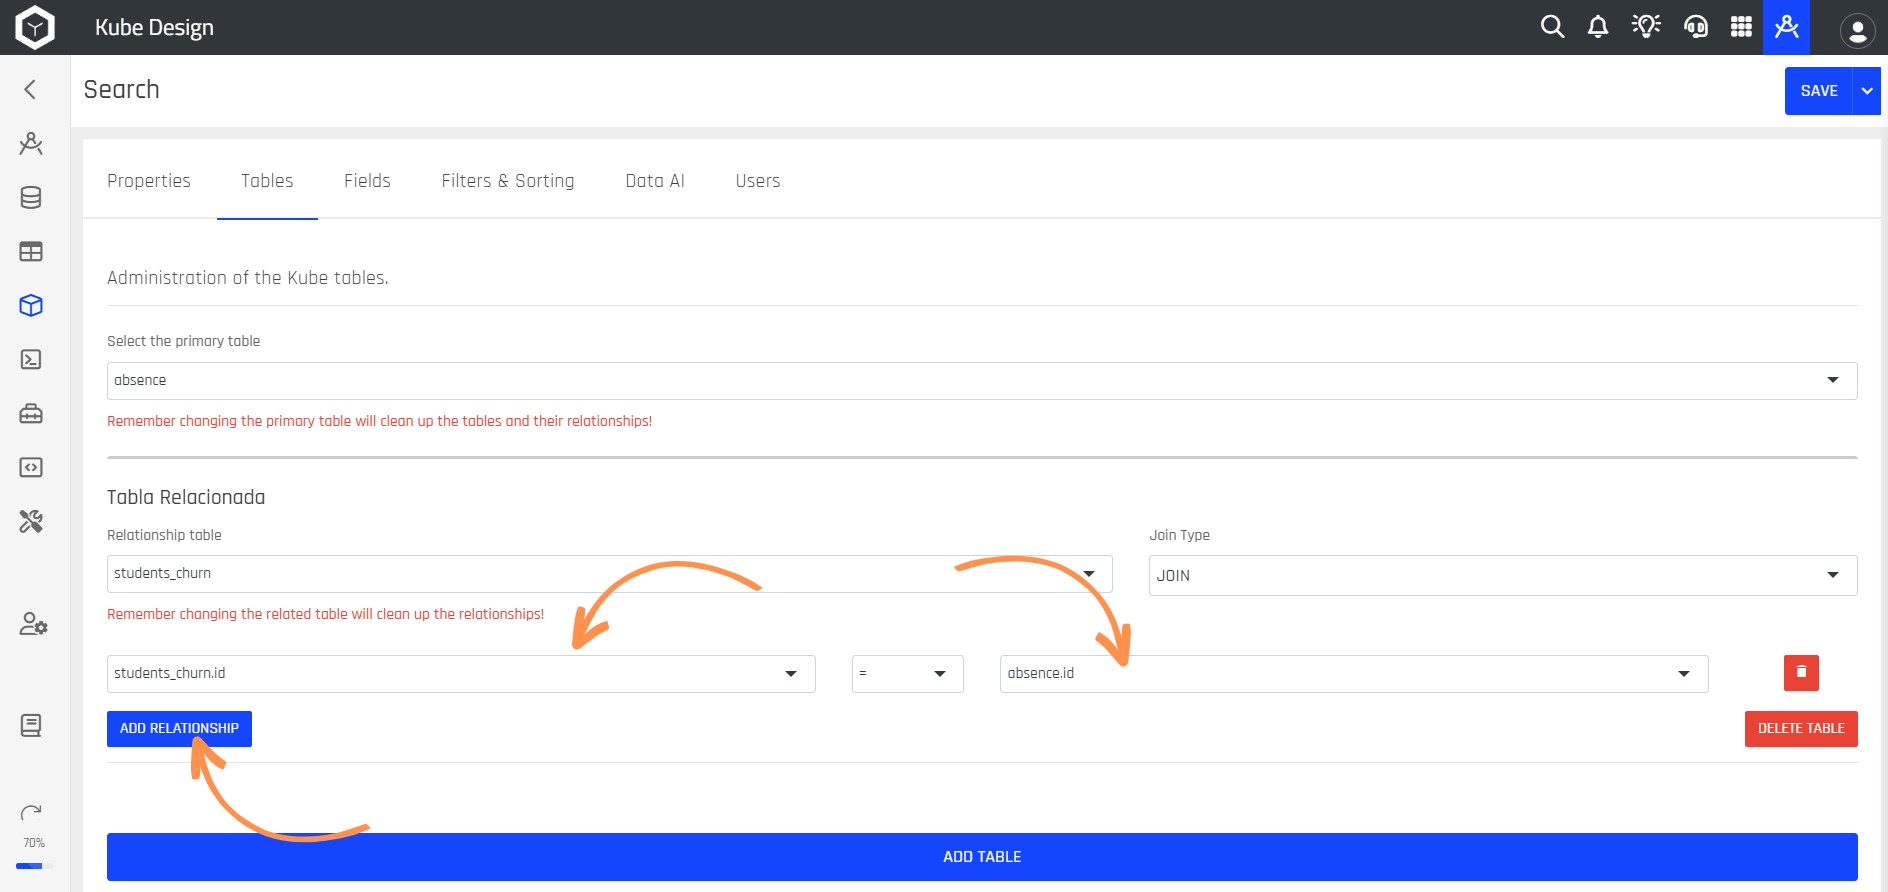
Step 6: Select the Tables option. Here, you will choose the primary table for your Kube, which comes from the repository you selected earlier.
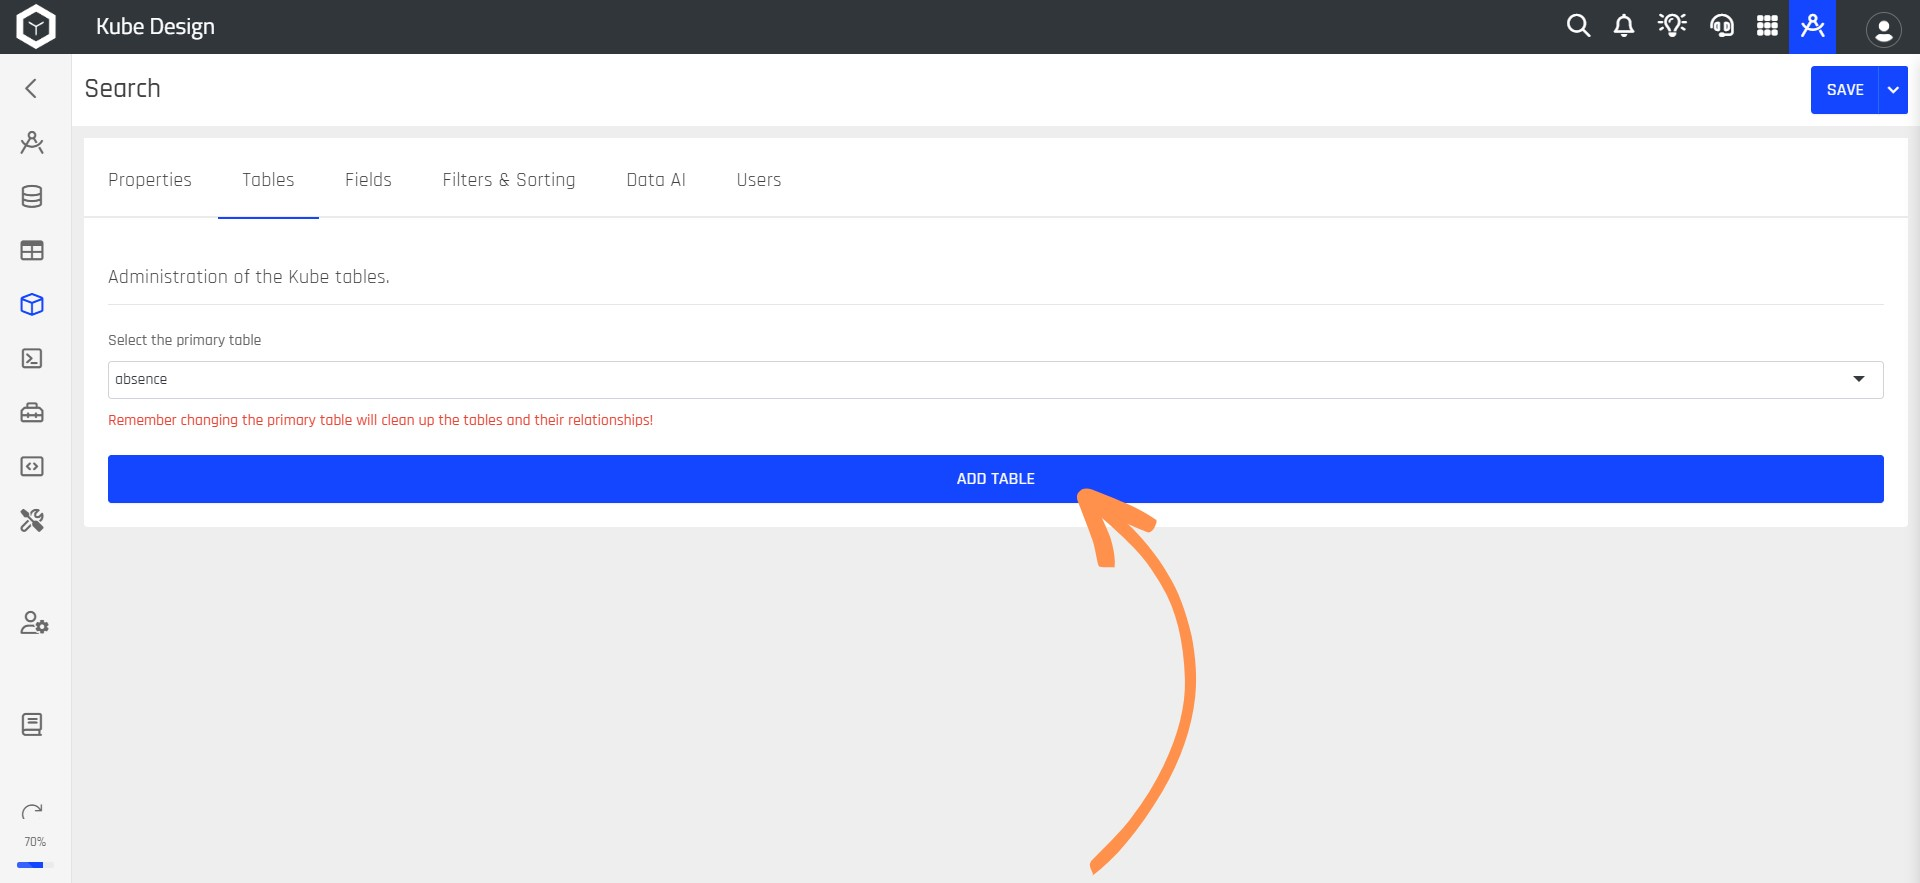
Step 7: If you want to organize more data within your Kube, select the ADD TABLE button.
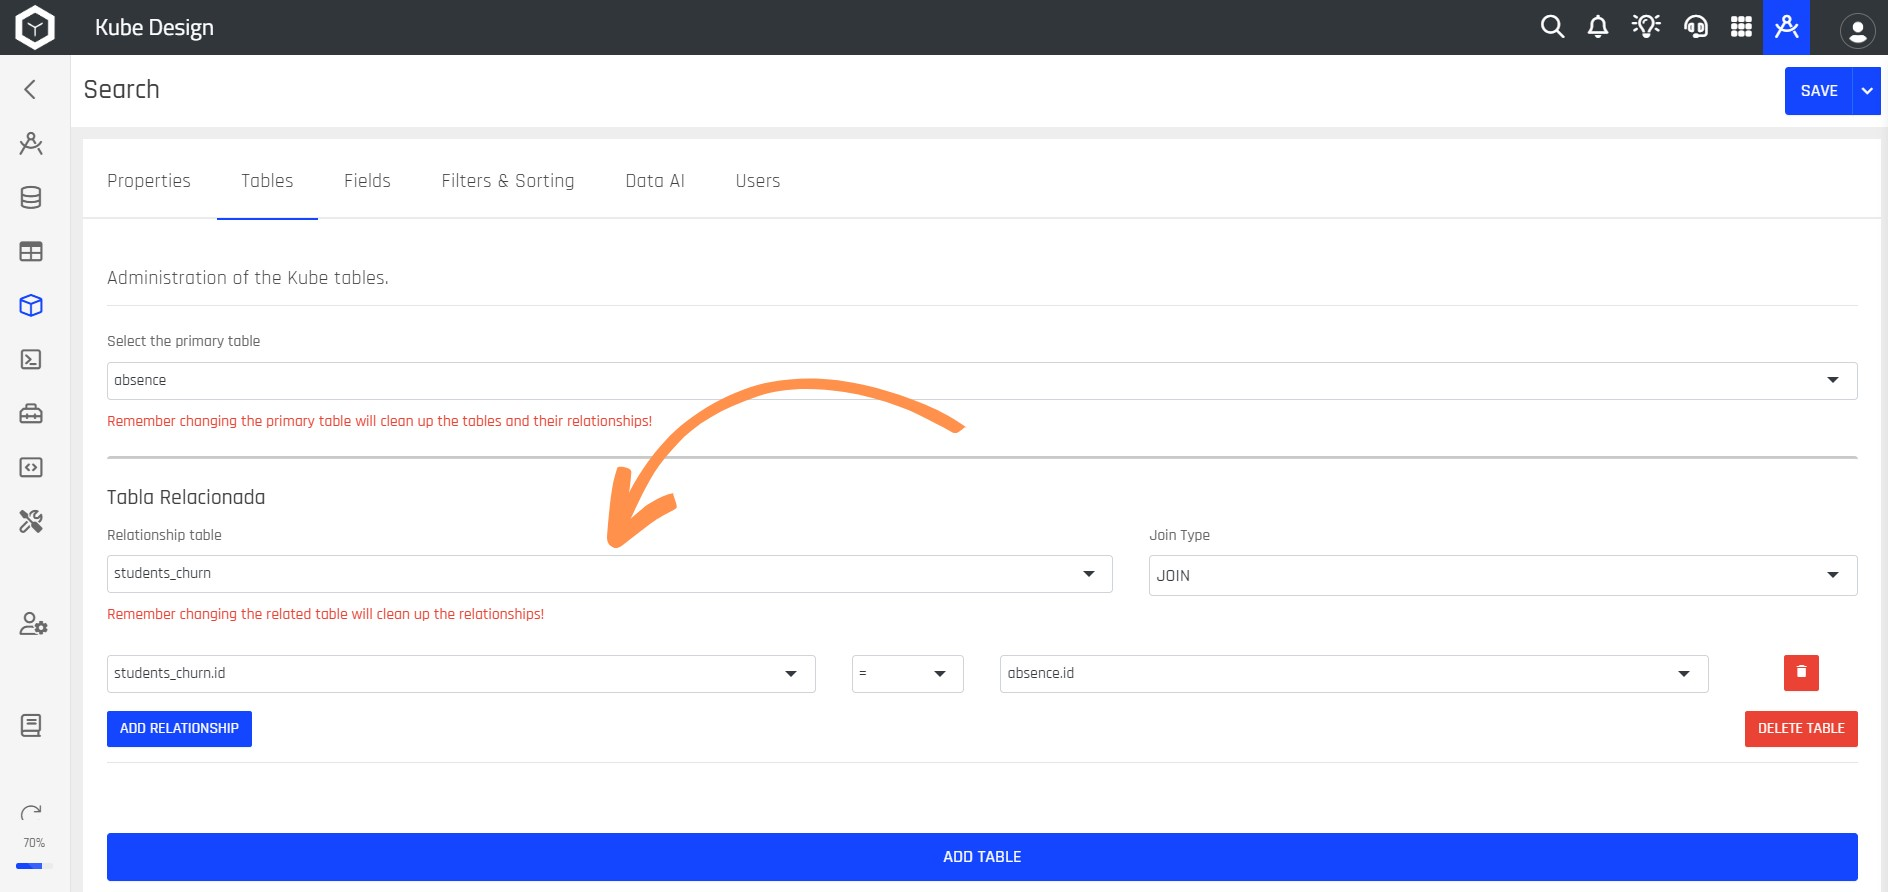
Step 8: Choose the table you want to relate to the primary table.
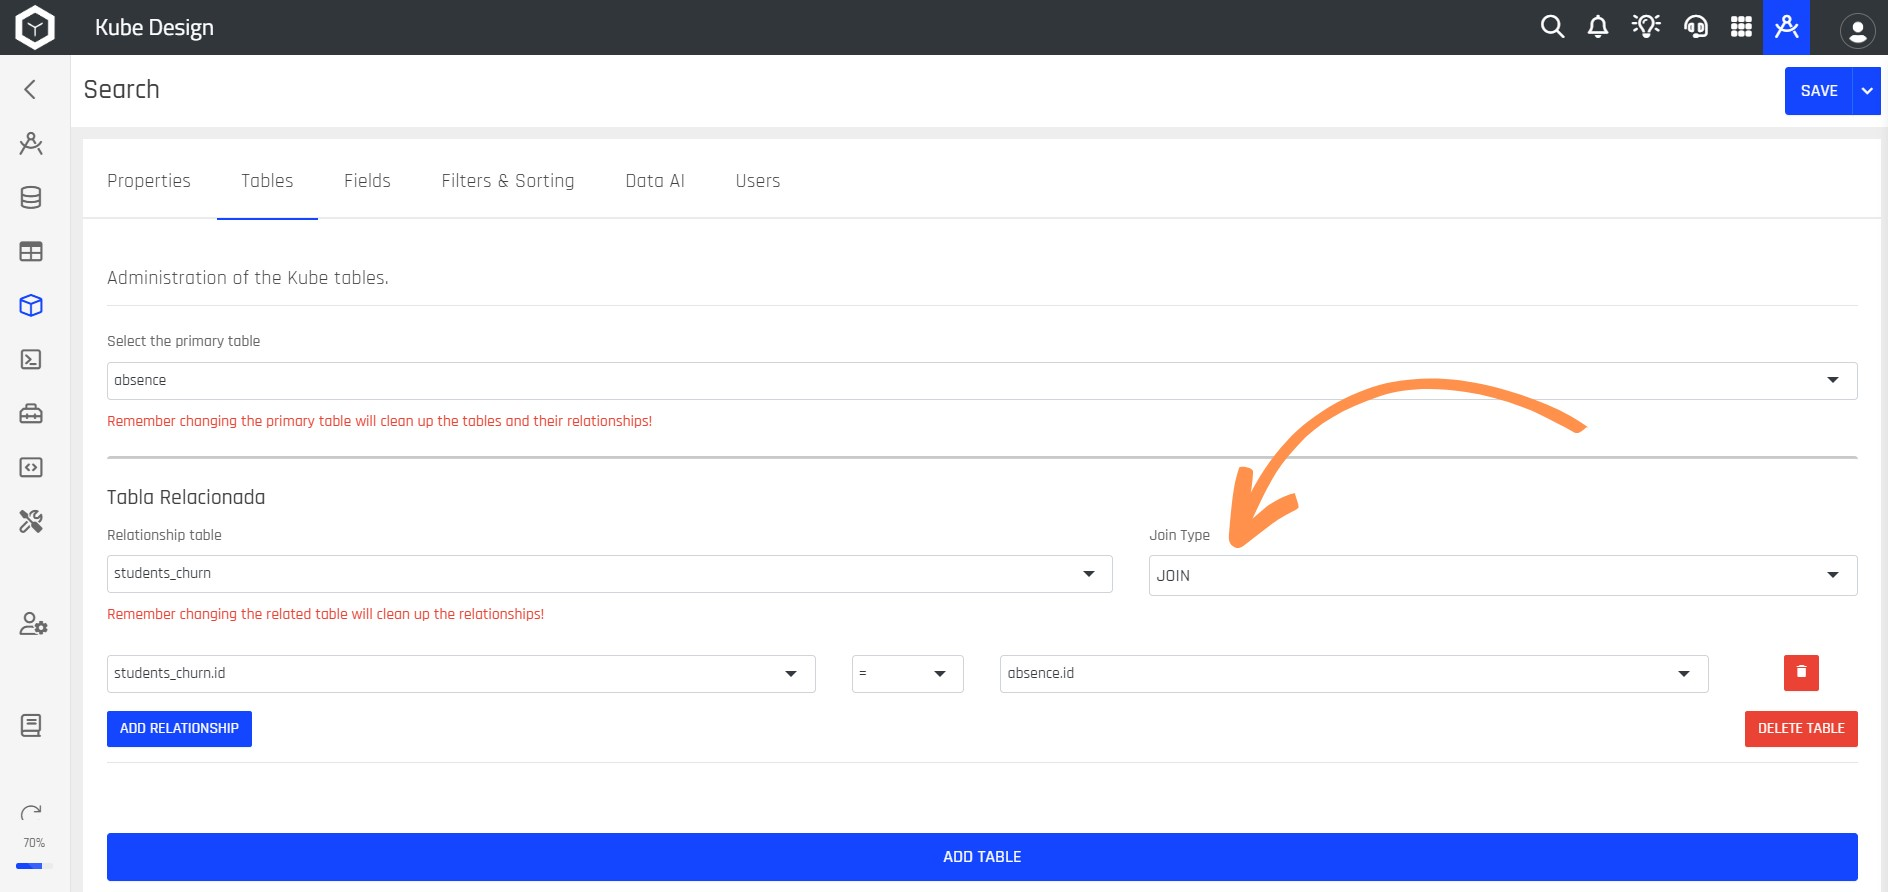
Step 9: Select the type of JOIN you want to perform between the two tables.
The following table provides more detailed explanations of the JOIN types:
| Join Type | Description |
|---|---|
| JOIN | Takes common elements in both tables and displays only those elements that match in both. |
| LEFT JOIN | Takes all elements from the first table and looks for matches in the second table. If there are matches, they are displayed along with the information from the first table. If there are no matches in the second table, the fields remain blank. |
| RIGHT JOIN | RIGHT JOIN works similarly to LEFT JOIN, but in this case, all rows from the right table are included in the final result along with the matching rows from the left table. If there are no matches in the left table, null fields are shown for those records. It's like taking all the items from the right list and finding their matches in the left list, but if there are no matches, blank spaces are shown. |
Step 10: After that, you should click the ADD RELATIONSHIP button and select the two columns that will be used as references for the JOIN.
Step 11: Then, select the Fields option and click the ADD MULTIPLE FIELDS button to add columns to your Kube.
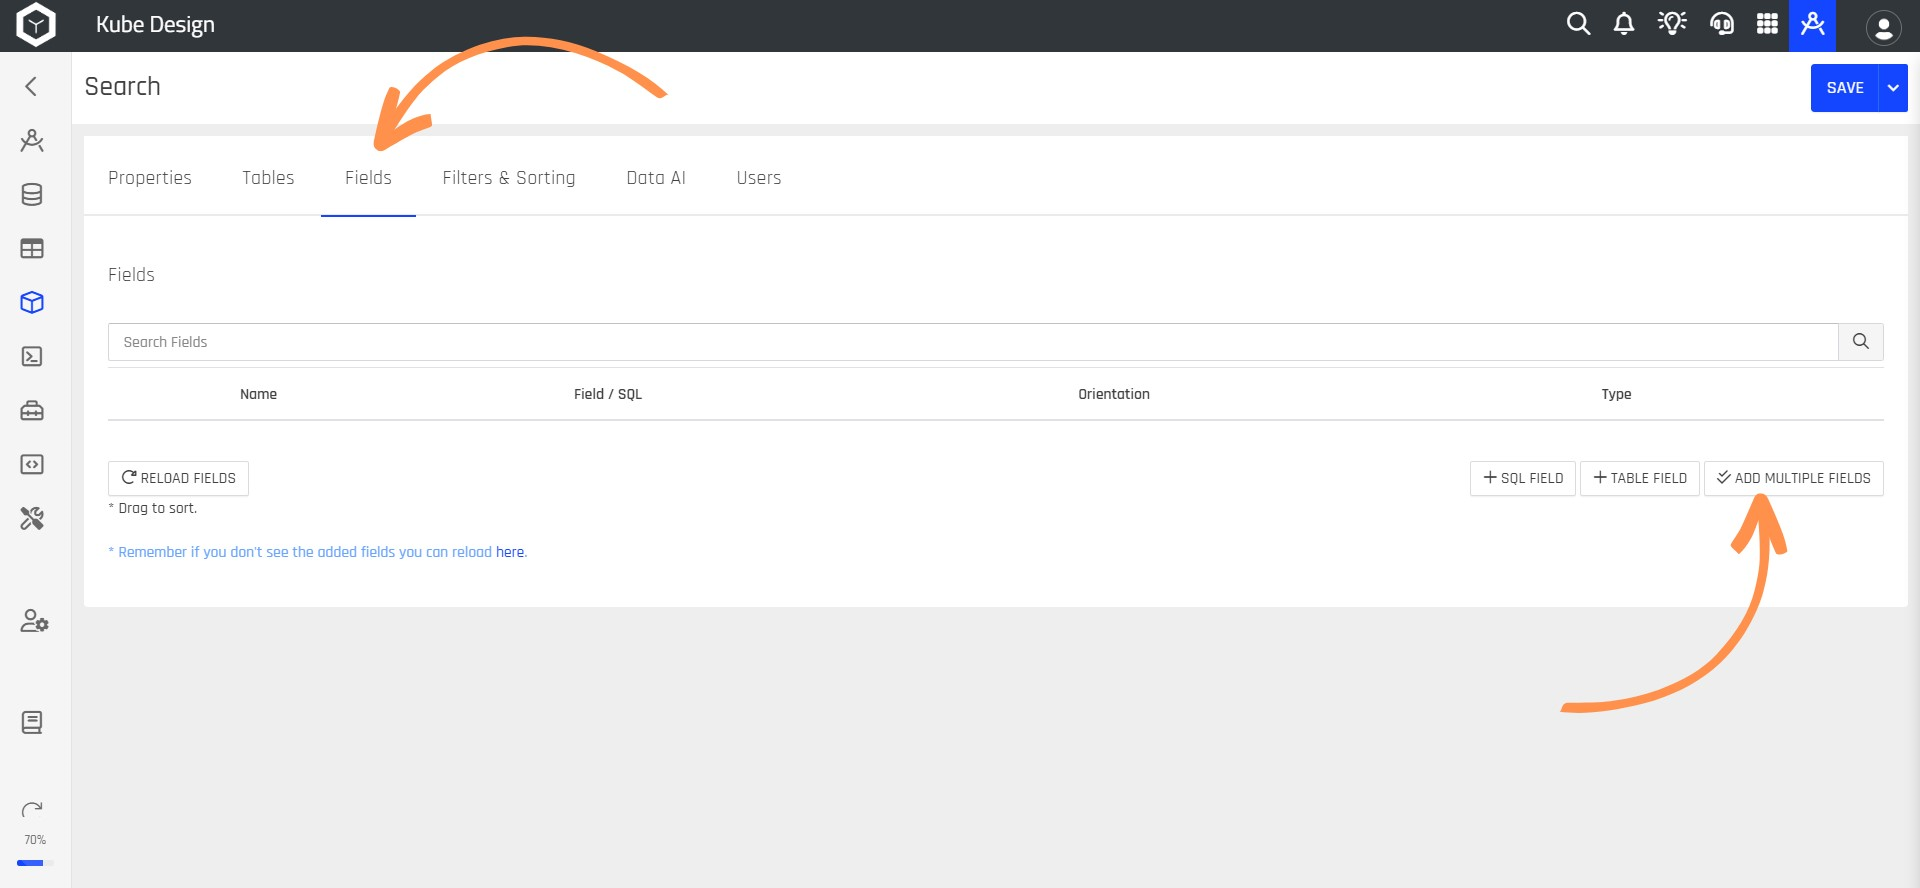
ADD MULTIPLE FIELDSThis function only works the first time you add columns massively to the Kube.
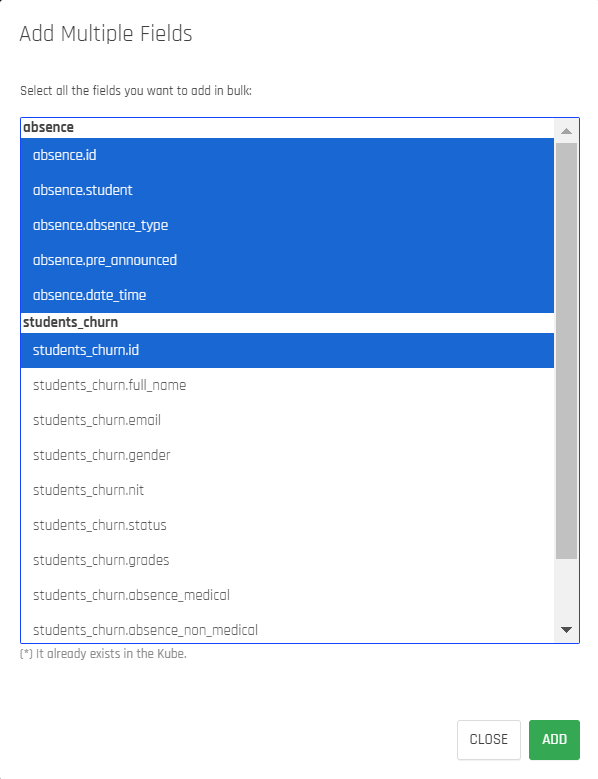
Step 12: Select the columns you want to add and click ADD.
Step 13: If you want to add another column, click the + TABLE FIELD button and select the column you want to add, as in the previous step.
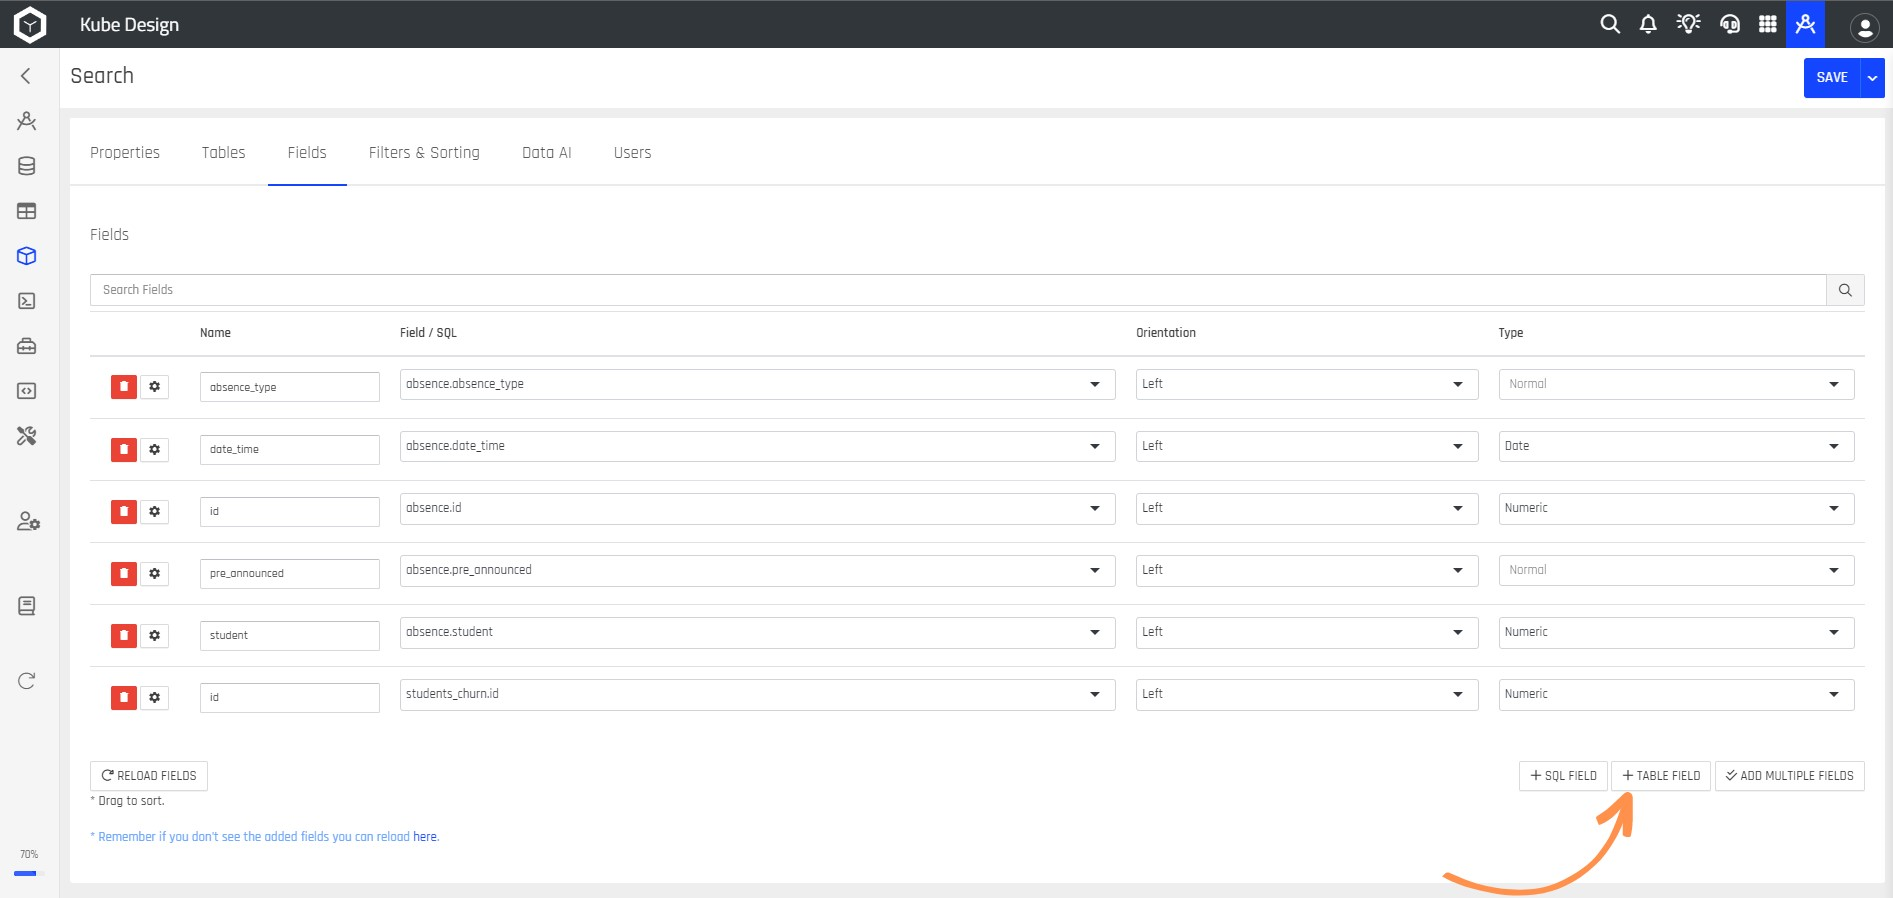
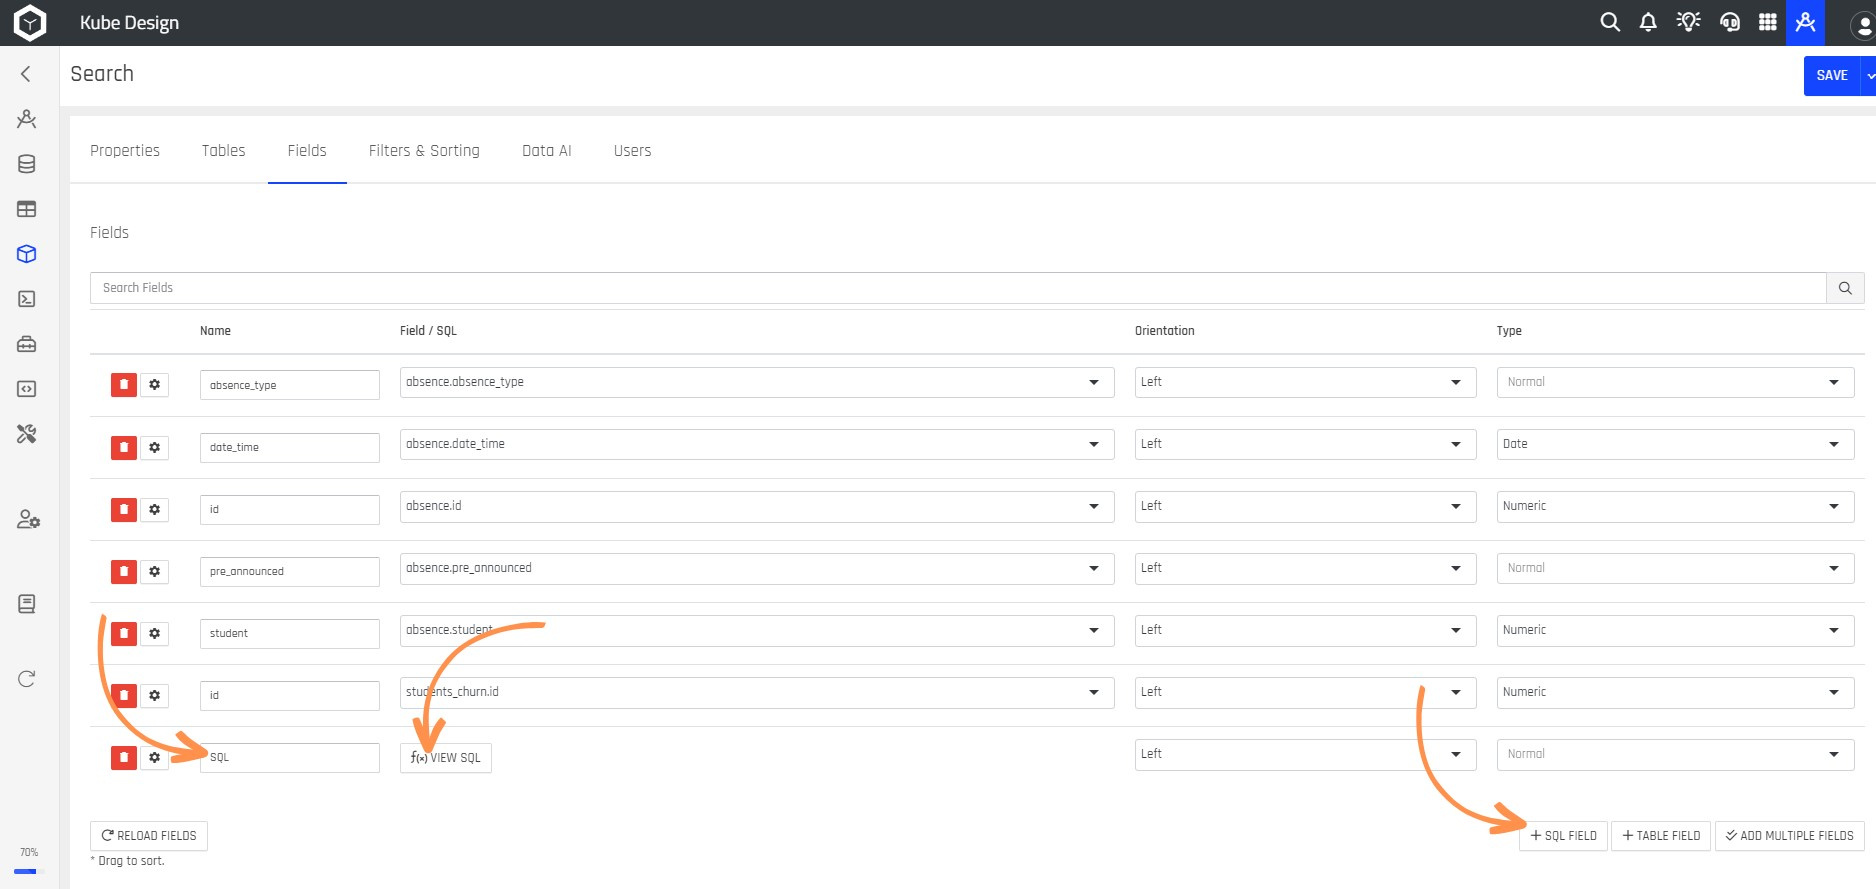
Step 14: If you want to add a field with a special function, such as performing a calculation or having a singular value, click the + SQL FIELD button. After adding the field, enter a Field Name, and click the f(x) VIEW SQL button.
Remember to Reload when Changing FieldsCurrently, the DataKubes Kube designer needs to be reloaded to load the report fields in the various necessary options. Therefore, we recommend pressing the "Reload Fields" button when making changes.
Step 15: A screen will then open where you can write the function of the field or the SQL value. Afterward, click the APPLY button.
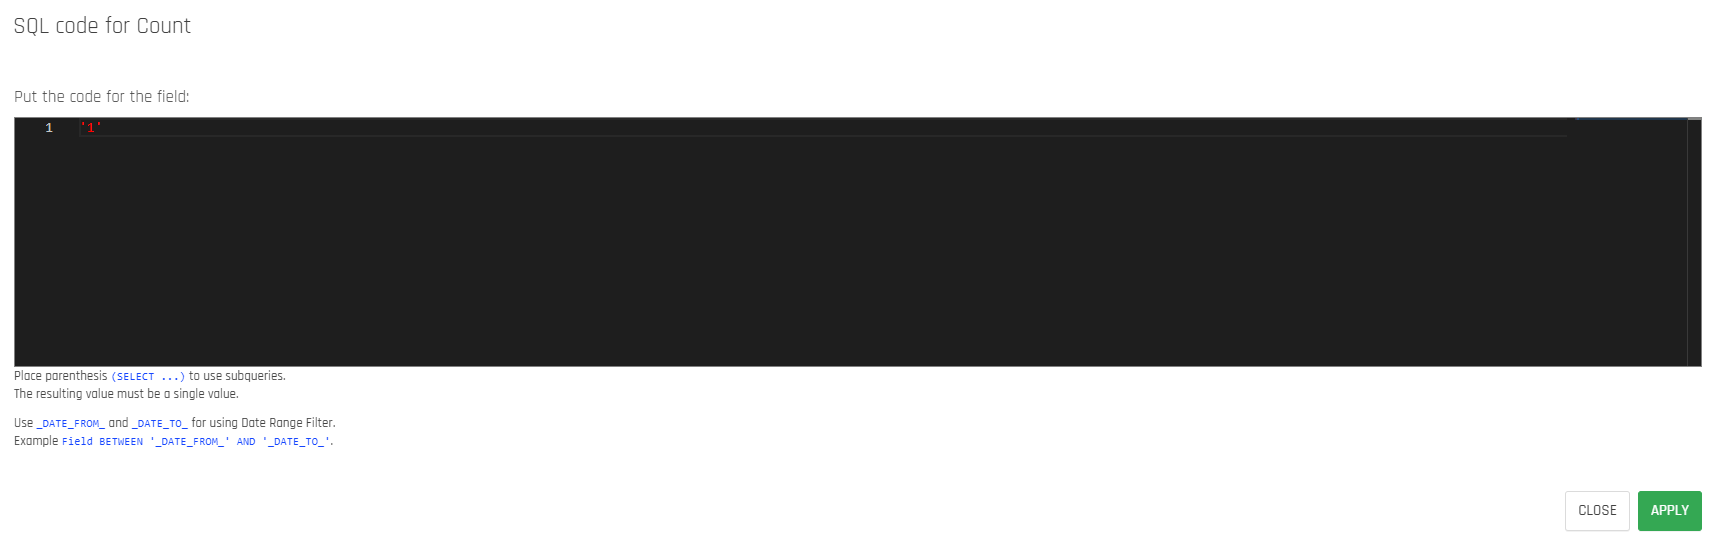
Variable "COUNT"It is recommended to add an SQL-type variable named COUNT with a value of '1'. This helps count each record in the cube, depending on the field configuration.
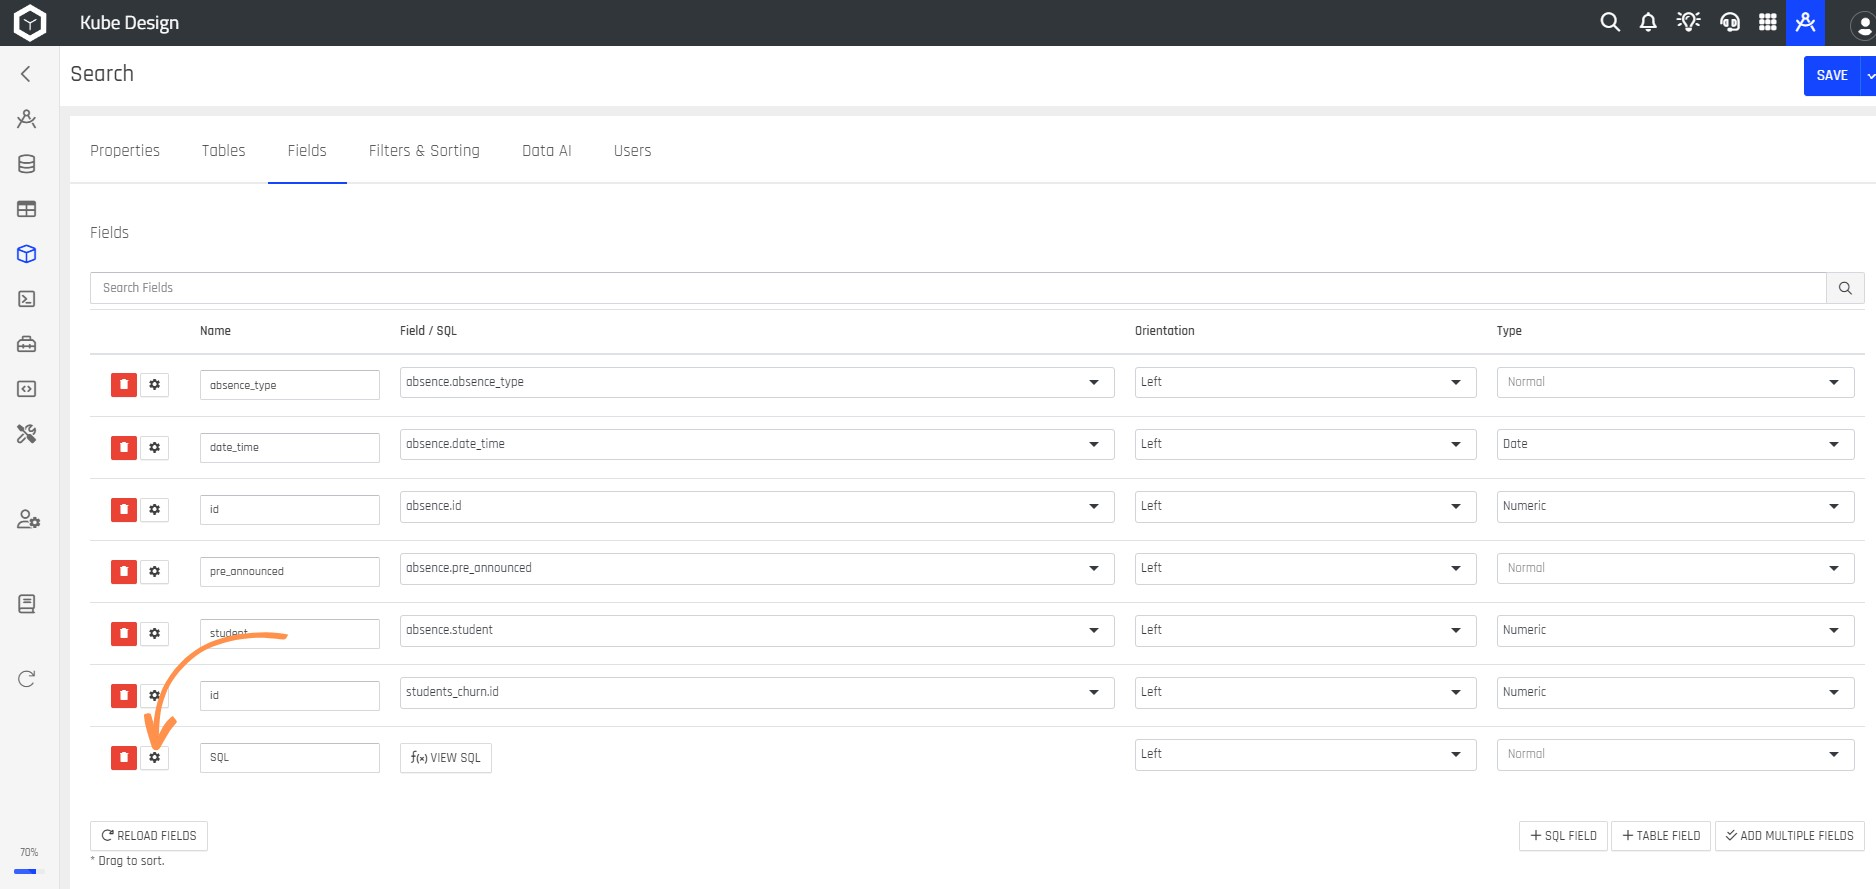
Step 16: To configure each field, click the ⚙️ button.
Step 17: You can configure the Field Count type if you want a grouper for sum, count, average, and more. You can also choose how data is displayed with Value Formatting.
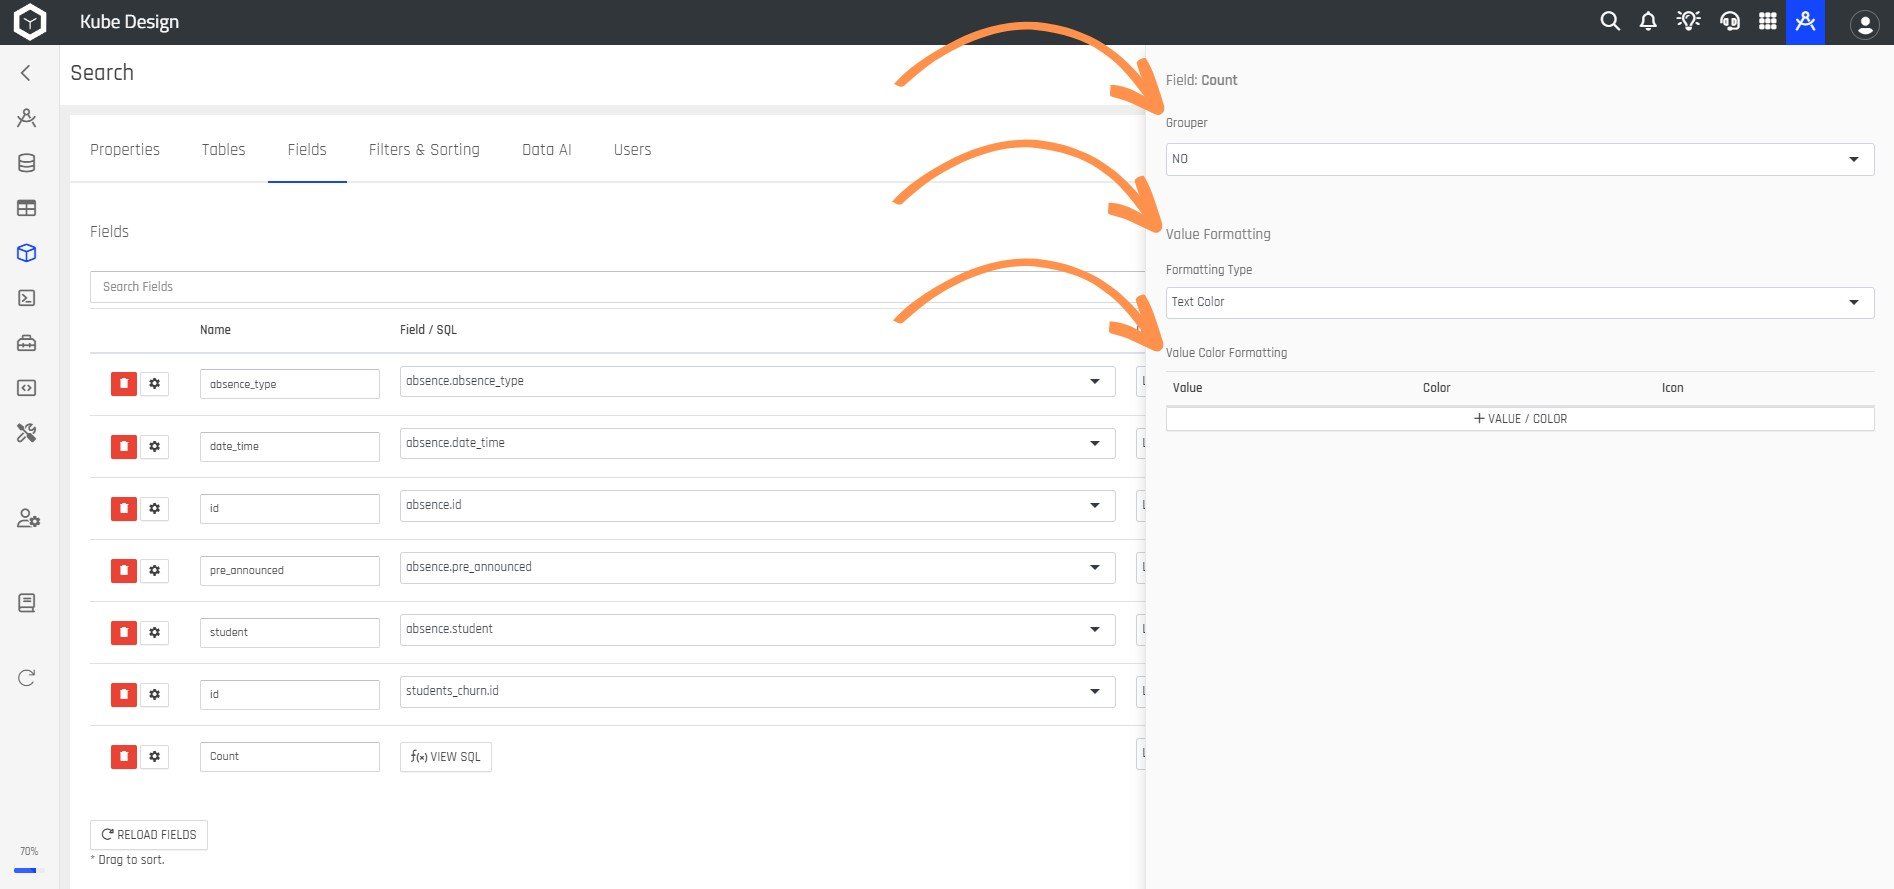
Step 18: Select
Updated over 1 year ago